import numpy as np
import matplotlib.pyplot as plt
from matplotlib import animation
from matplotlib import rcAnimations
Sometimes explaining a complex topic becomes a lot easier by using an animation of a plot. It could showing how the graph changes over a paramter. It is even more helpful if we try to do combine more than one plot.
Simple Animations
Matplotlib plots are made of visible objects called artists. Each line, curve, point that we draw on a plot is called an artist. To make an animation, we need to create a plot and write a function that updates the required artists.
# NOTE: This is important. The animation will not play without this.

# configure matplotlib to show html animations
rc('animation', html='html5')
As an example, we’ll plot a parabola using the formula \(y = a x^2\) with \(a\) going from \(0\) to \(1\).
# define a, x and y
a = 1.0
x = np.linspace(-10, 10, 1000)
y = a*x*x
# create a figure
fig = plt.figure()
# plot returns a list of lines, we need to remember the first one, so that we can modify it
lines = plt.plot(x, y)
line = lines[0]
# We also want to remember the title so that we can update it later.
title = plt.title("$y = {a}x^2$")
plt.grid()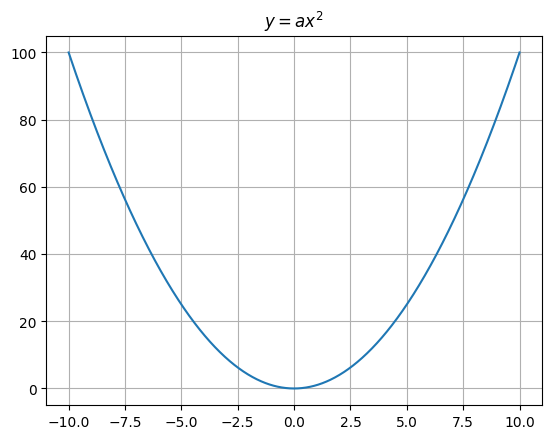
We got a plot, but what we really need an animation, not a staic plot.
In the following cell, we’ll write a function update that takes the frame number and updates the data for the line and the title for each frame.
num_frames = 100

def update(frame):
    """Function to update the figure for given frame number.
    """
    # a is going from 0 to 1 and we have 100 frames
    # dividing the curent frame number by num_frames will give a value between 0 and 1
    a = frame/num_frames

    # compute x and y again
    x = np.linspace(-10, 10, 1000)
    y = a*x*x

    # update the data for the line (or the parabola)
    line.set_data(x, y)

    # update thext of the title
    title.set_text(f"$y = {a} x^2$")
# Create an animation
# It will take a while to render all the frames and make it into a video
animation.FuncAnimation(fig, update, frames=num_frames)Example: Moving over a circle
Let’s look at a more complex example of animation now. We are going to look at motion around a circle and how the x and y coordinates change and correlate that with \(sin\) and \(cos\).
# Let's work with angles and it will be easier to understand
# We are dividing [0, 360] into 10 degree intervals, so we'll have 37 points in total as we are coming back to the starting point
angles = np.linspace(0, 360, 37)

theta = np.radians(angles)
r = 1

x = r * np.cos(theta)
y = r * np.sin(theta)

fig = plt.figure(figsize=(4, 4))
plt.plot(x, y)
plt.grid()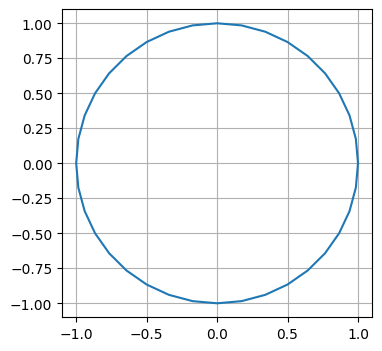
As the first step, we’ll make a point go over the circle.
# Let's work with angles and it will be easier to understand
# We are dividing [0, 360] into 10 degree intervals, so we'll have 37 points in total as we are coming back to the starting point
angles = np.linspace(0, 360, 37)

theta = np.radians(angles)
r = 1

x = r * np.cos(theta)
y = r * np.sin(theta)

fig = plt.figure(figsize=(4, 4))
plt.plot(x, y)
plt.grid()

angle = 30
px = np.cos(np.radians(angle))
py = np.sin(np.radians(angle))

# plot a red color, circle marker
# see https://matplotlib.org/stable/api/markers_api.html
plt.plot(px, py, 'ro')

# Let's also mark origin
plt.plot(0, 0, 'ro')

# and connect them using a dotted line
plt.plot([0, px], [0, py], 'r--')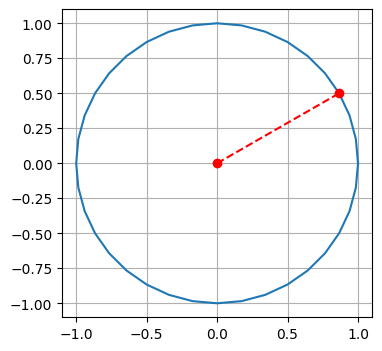
To turn this into an animation, we need to remember the artists and update them for each frame.
# Let's work with angles and it will be easier to understand
# We are dividing [0, 360] into 10 degree intervals, so we'll have 37 points in total as we are coming back to the starting point
angles = np.linspace(0, 360, 37)

theta = np.radians(angles)
r = 1

x = r * np.cos(theta)
y = r * np.sin(theta)

fig = plt.figure(figsize=(4, 4))
plt.plot(x, y)
plt.grid()

angle = 0
px = np.cos(np.radians(angle))
py = np.sin(np.radians(angle))

# plot a red color, circle marker
# see https://matplotlib.org/stable/api/markers_api.html
p1, = plt.plot(px, py, 'ro')

# Let's also mark origin
p2, = plt.plot(0, 0, 'ro')

# and connect them using a dotted line
line1, = plt.plot([0, px], [0, py], 'r--')

title = plt.title("")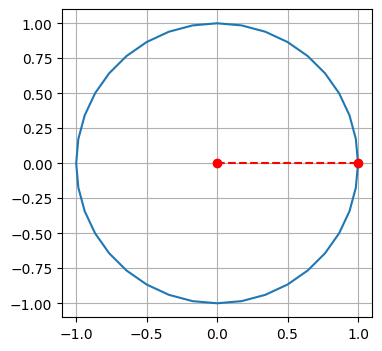
# move by 15 degrees
num_frames = 24

def update(frame):
    angle = frame/num_frames*360

    px = np.cos(np.radians(angle))
    py = np.sin(np.radians(angle))

    p1.set_data(px, py)
    line1.set_data([0, px], [0, py])

    title.set_text(rf"$\theta = {angle}\degree$")
animation.FuncAnimation(fig, update, frames=num_frames, interval=500)/tmp/ipykernel_25710/1378687440.py:10: MatplotlibDeprecationWarning: Setting data with a non sequence type is deprecated since 3.7 and will be remove two minor releases later
p1.set_data(px, py)fig, ax = plt.subplots()
def draw(ax):
# Let's work with angles and it will be easier to understand
# We are dividing [0, 360] into 10 degree intervals, so we'll have 37 points in total as we are coming back to the starting point
angles = np.linspace(0, 360, 37)
theta = np.radians(angles)
r = 1
x = r * np.cos(theta)
y = r * np.sin(theta)
fig = plt.figure(figsize=(4, 4))
plt.plot(x, y)
plt.grid()
angle = 30
px = np.cos(np.radians(angle))
py = np.sin(np.radians(angle))
# plot a red color, circle marker
# see https://matplotlib.org/stable/api/markers_api.html
plt.plot(px, py, 'ro')
# Let's also mark origin
plt.plot(0, 0, 'ro')
# and connect them using a dotted line
plt.plot([0, px], [0, py], 'r--')# plt.ioff()
fig, ax = plt.subplots()
rng = np.random.default_rng(19680801)
data = np.array([20, 20, 20, 20])
x = np.array([1, 2, 3, 4])
artists = []
colors = ['tab:blue', 'tab:red', 'tab:green', 'tab:purple']
for i in range(20):
ax.clear()
data += rng.integers(low=0, high=10, size=data.shape)
container = ax.barh(x, data, color=colors)
title = ax.set_title(f"i={i}")
artists.append([container])
# plt.ion()animation.ArtistAnimation(fig=fig, artists=artists, interval=400)--------------------------------------------------------------------------- AttributeError Traceback (most recent call last) File ~/.local/lib/python3.10/site-packages/IPython/core/formatters.py:342, in BaseFormatter.__call__(self, obj) 340 method = get_real_method(obj, self.print_method) 341 if method is not None: --> 342 return method() 343 return None 344 else: File ~/.local/lib/python3.10/site-packages/matplotlib/animation.py:1361, in Animation._repr_html_(self) 1359 fmt = mpl.rcParams['animation.html'] 1360 if fmt == 'html5': -> 1361 return self.to_html5_video() 1362 elif fmt == 'jshtml': 1363 return self.to_jshtml() File ~/.local/lib/python3.10/site-packages/matplotlib/animation.py:1288, in Animation.to_html5_video(self, embed_limit) 1284 Writer = writers[mpl.rcParams['animation.writer']] 1285 writer = Writer(codec='h264', 1286 bitrate=mpl.rcParams['animation.bitrate'], 1287 fps=1000. / self._interval) -> 1288 self.save(str(path), writer=writer) 1289 # Now open and base64 encode. 1290 vid64 = base64.encodebytes(path.read_bytes()) File ~/.local/lib/python3.10/site-packages/matplotlib/animation.py:1090, in Animation.save(self, filename, writer, fps, dpi, codec, bitrate, extra_args, metadata, extra_anim, savefig_kwargs, progress_callback) 1085 with mpl.rc_context({'savefig.bbox': None}), \ 1086 writer.saving(self._fig, filename, dpi), \ 1087 cbook._setattr_cm(self._fig.canvas, 1088 _is_saving=True, manager=None): 1089 for anim in all_anim: -> 1090 anim._init_draw() # Clear the initial frame 1091 frame_number = 0 1092 # TODO: Currently only FuncAnimation has a save_count 1093 # attribute. Can we generalize this to all Animations? File ~/.local/lib/python3.10/site-packages/matplotlib/animation.py:1498, in ArtistAnimation._init_draw(self) 1496 for f in self.new_frame_seq(): 1497 for artist in f: -> 1498 artist.set_visible(False) 1499 artist.set_animated(self._blit) 1500 # Assemble a list of unique figures that need flushing AttributeError: 'BarContainer' object has no attribute 'set_visible'
1 + 23Animation Utilities
# Utilities to draw

class Animation:
    def __init__(self, fig, frames, datafunc, **kwargs):
        """Creates an animation.

        Parameters
        ----------

        fig
            The matplotlib figure to animate on.

        frames
            Number of frames

        datafunc
            A function that takes theta and returns x and y

        kwargs
            Optional keyworkd arguments passed to matplotlib.animation.FuncAnimation.
        """
        self.fig = fig
        self.frames = frames
        self.datafunc = datafunc
        self.kwargs = kwargs
        self.objects = []
        self._anim = None

    def draw_frame(self, frame):
        angle = frame/self.frames*2*np.pi
        x, y = self.datafunc(angle)
        ctx = Context(angle=angle, x=x, y=y)
        return [obj.update(ctx) for obj in self.objects]

    def render(self):
        self._anim = animation.FuncAnimation(self.fig, self.draw_frame, self.frames, **self.kwargs)

    def add_line(self, ax, fmt, datafunc):
        """Adds a line to the animation.

        Parameters
        ----------

        ax
            The axis to draw the line on

        fmt
            The format of the line to draw. e.g. 'r-'

        datafunc:
            A function that takes the context as argument and returns [x1, y1, x2, y2].
        """
        line = Line(ax, fmt, datafunc)
        self.objects.append(line)

    def add_point(self, ax, fmt, datafunc):
        """Adds a point to the animation.

        Parameters
        ----------

        ax
            The axis to draw the line on

        fmt
            The format of the line to draw. e.g. 'r-'

        datafunc:
            A function that takes the context as argument and returns [x1, y1].
        """
        p = Point(ax, fmt, datafunc)
        self.objects.append(p)

class Context:
    def __init__(self, angle=0, x=0, y=0):
        self.angle = angle
        self.x = x
        self.y = y

class Line:
    def __init__(self, ax, fmt, datafunc):
        self.datafunc = datafunc
        self.obj, = ax.plot([0, 0], [0, 0], fmt)

    def update(self, ctx):
        x1, y1, x2, y2 = self.datafunc(ctx)
        self.obj.set_data([x1, x2], [y1, y2])
        return self.obj

class Point:
    def __init__(self, ax, fmt, datafunc):
        self.datafunc = datafunc
        self.obj, = ax.plot(0, 0, fmt)

    def update(self, ctx):
        x, y = self.datafunc(ctx)
        self.obj.set_data([x], [y])
        return self.obj

class ParametericAnimation(Animation):
    def __init__(self, func, frames=36):
        fig = plt.figure(figsize=(8, 8))
        super().__init__(fig, frames, func)
        self.draw()

    def draw(self):
        ax0 = plt.subplot(2, 2, 3)
        ax1 = plt.subplot(2, 2, 1)
        ax2 = plt.subplot(2, 2, 4)

        # ticks = np.linspace(0, 2*np.pi, 9)
        # tick_labels = [
        #     r"$0$", r"$\frac{\pi}{4}$",
        #     r"$\frac{\pi}{2}$", r"$\frac{3\pi}{4}$",
        #     r"$\pi$", r"$\frac{5\pi}{4}$",
        #     r"$\frac{3\pi}{2}$", r"$\frac{7\pi}{4}$",
        #     r"$2\pi$"]
        ticks = np.linspace(0, 2*np.pi, 5)
        tick_labels = [
            r"$0$",  r"$\frac{\pi}{2}$",
            r"$\pi$", r"$\frac{3\pi}{2}$",  r"$2\pi$"]

        t = np.linspace(0, 2*np.pi, 1000)
        x, y = self.datafunc(t)

        ax0.plot(x, y)
        ax0.grid()

        ax1.plot(x, t, 'r-')
        ax1.grid()
        ax1.axline([0, 0], [0, 2*np.pi], color='gray')
        ax1.set_yticks(ticks, tick_labels)

        ax2.plot(t, y, 'g-')
        ax2.grid()
        ax2.axline([0, 0], [2*np.pi, 0], color='gray')
        ax2.set_xticks(ticks, tick_labels)

        self.add_line(ax0, 'b--', lambda ctx: [0, 0, ctx.x, ctx.y])
        self.add_line(ax0, 'r--', lambda ctx: [0, 0, ctx.x, 0])
        self.add_line(ax0, 'g--', lambda ctx: [ctx.x, 0, ctx.x, ctx.y])

        self.add_point(ax0, 'bo', lambda ctx: [0, 0])
        self.add_point(ax0, 'bo', lambda ctx: [ctx.x, ctx.y])

        self.add_point(ax1, 'ro', lambda ctx: [ctx.x, ctx.angle])
        self.add_line(ax1, 'r--', lambda ctx: [0, ctx.angle, ctx.x, ctx.angle])

        self.add_point(ax2, 'go', lambda ctx: [ctx.angle, ctx.y])
        self.add_line(ax2, 'g--', lambda ctx: [ctx.angle, 0, ctx.angle, ctx.y])

def func(t):
    x = np.cos(t)
    y = np.sin(t)
    return x, y

ani = ParametericAnimation(func)
ani.render()